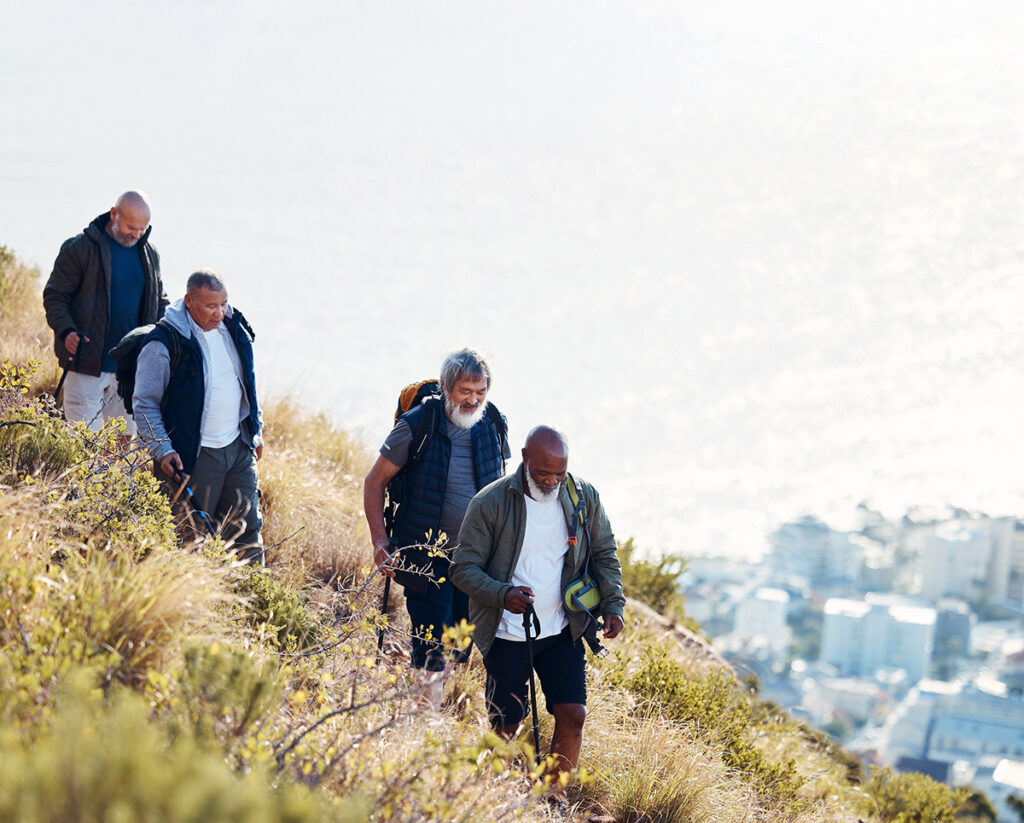
THE SUPER CASUAL SEGMENT
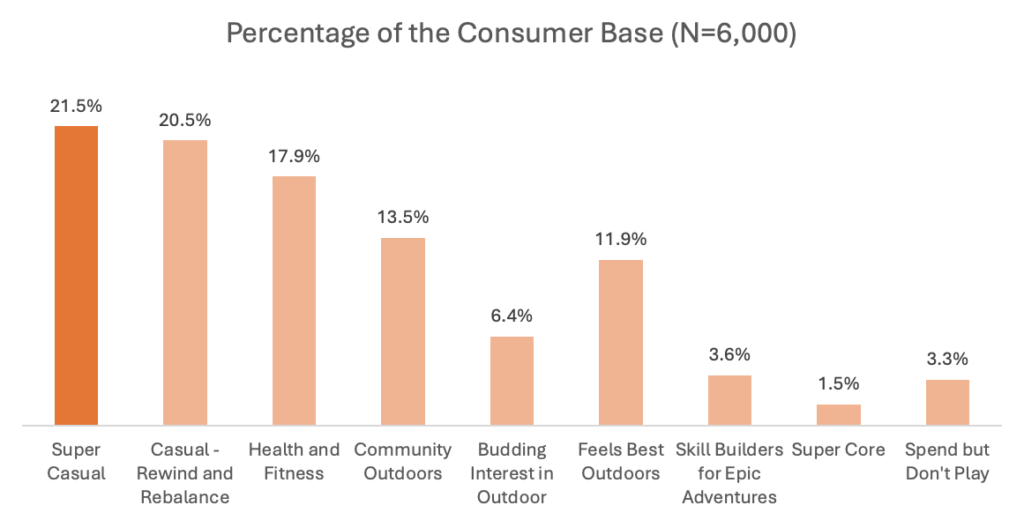
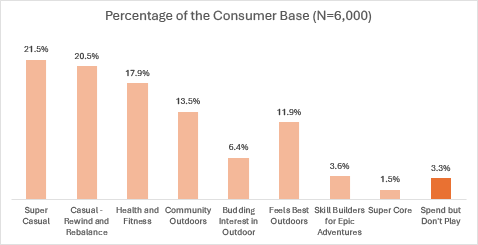
The Super Casual segment, representing 22% of outdoor consumers and the largest of nine identified segments, consists of individuals who engage with the outdoors occasionally and without a lot of intensity or aggression. These consumers prioritize emotional benefits of outdoor activity like calmness, happiness, and confidence over excitement or challenge. They participate in low-barrier activities such as walking, running, and biking and tend to engage less than 49 times annually. Despite their infrequent activity, Super Casuals are willing to spend on gear and apparel—primarily due to wear or to try new activities—with Amazon and mass retailers being their top shopping destinations. Their purchasing decisions are driven by product durability, quality, and aesthetic appeal rather than brand prestige. The segment skews female, with an average age of 42, a majority white racial makeup, and most living in households earning under $80,610. They are slightly less educated than the general population, suggesting that simple, benefits-focused marketing and accessible outdoor experiences are key to engaging them further.
KEY INSIGHTS:
- Market Size & Identity: Largest outdoor segment: 22% of all outdoor consumers, defined by a low-intensity, occasional approach to outdoor activities.
- Participation Patterns
Infrequent participation with typically less than 49 times/year. Preferred activities are walking, running, biking. Least interested in snow sports, hunting, climbing. - Purchase Drivers
Top reasons to purchase are existing gear is worn-out, or they are trying a new activity. Purchases peak at the start of seasonal transitions. Motivations: available in full report
Spending Behavior: available in full report
Decision Influences: available in full report
Product Preferences: available in full report
Shopping Channels: available in full report
Demographics: available in full report
Socioeconomic Traits: available in full report
MEMBERS GET ALL THE INSIGHTS. JOIN TODAY.
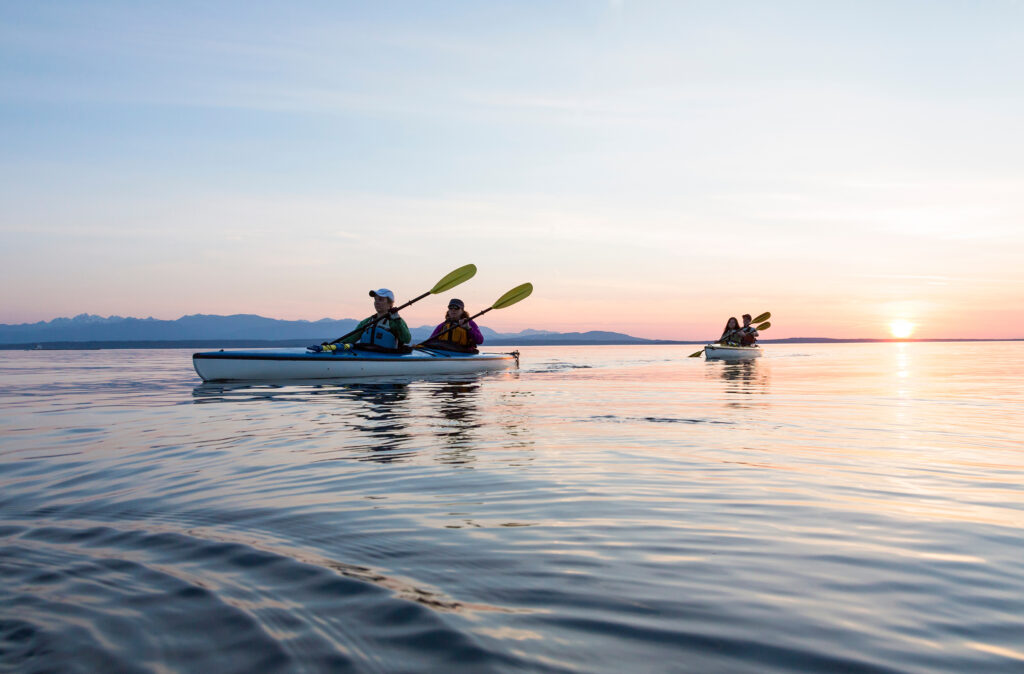
THE CASUAL – REWIND & REBALANCE SEGMENT
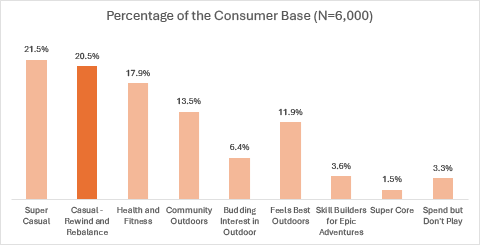
The Casual – Rewind and Rebalance segment represents a significant and emotionally driven portion of the outdoor consumer base, accounting for 21% of all outdoor participants and forming a major part of the “casual” consumer group alongside the Super Casual segment. These individuals prioritize emotional wellness, seeking calm, happiness, and balance—over intensity or thrill in their outdoor experiences. While they participate less frequently than most other segments, they are still valuable to the outdoor industry, with an average six-month spend of over $1,300 on gear and apparel. Their purchase decisions are guided by durability, value, and ethical brand practices, and they tend to research purchases through trusted retail and brand channels rather than influencers or guides. With a strong preference for in-store or blended shopping and a high concentration of women, middle-income earners, and adults over 35, this segment presents major opportunities for brands to deepen relationships through accessible experiences, ethical branding, and strong in-store engagement.
KEY INSIGHTS:
- Market Size & Identity – Comprises 21% of all outdoor consumers, making it the second largest of nine segments; combined with Super Casuals, they represent 42% of the market.
- Participation Patterns: Participate less than 49 times per year, with many participating fewer than 11 times annually.
- Purchase Drivers: Top reason for purchasing new gear is worn-out equipment—durability is key. Also value affordability, brand ethics, and product quality.
Motivations: available in full report
Spending Behavior: available in full report
Decision Influences: available in full report
Product Preferences: available in full report
Shopping Channels: available in full report
Demographics: available in full report
Socioeconomic Traits: available in full report
MEMBERS GET ALL THE INSIGHTS. JOIN TODAY.

THE HEALTH AND FITNESS SEGMENT
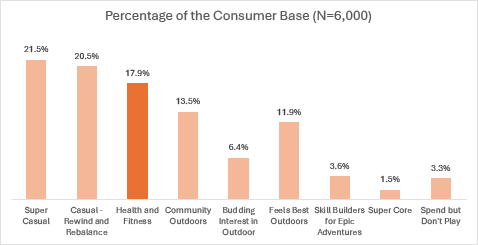
The Health and Fitness segment represents outdoor consumers who prioritize physical well-being, identify their primary motivation for engaging in outdoor activities as improving overall health and fitness. Comprising 18% of all outdoor consumers, this group marks the beginning of the more active and invested segments, participating with moderate intensity and spending at mid-tier levels. While their participation frequency remains relatively low, their chosen activities—such as walking, biking, running, and hiking—emphasize consistent aerobic movement. They seek a mix of emotional rewards including excitement, calm, and focus, and are responsive to products and experiences that support those goals. With a balanced gender split, racial diversity, and a wide distribution of income and education levels, the Health and Fitness segment is a promising and dynamic consumer group for outdoor brands to engage.
KEY INSIGHTS:
- Market Size & Identity: Makes up 18% of outdoor consumers; third-largest of nine identified segments.
- Participation Patterns: Participate mostly in walking, biking, running, and hiking; infrequent engagement (typically <49 times/year).
- Purchase Drivers: Replace worn-out gear, seek performance upgrades, and are drawn to new innovations like hydration gear and technical apparel.
Motivations: available in full report
Spending Behavior: available in full report
Decision Influences: available in full report
Product Preferences: available in full report
Shopping Channels: available in full report
Demographics: available in full report
Socioeconomic Traits: available in full report
MEMBERS GET ALL THE INSIGHTS. JOIN TODAY.

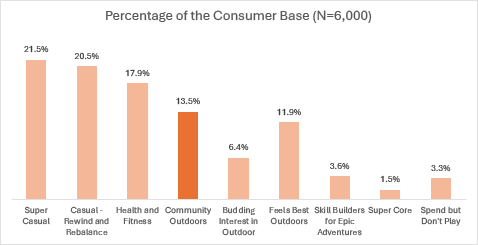
THE COMMUNITY OUTDOORS SEGMENT
The Community Outdoors segment represents outdoor consumers who prioritize social activities and use outdoor activities as a vehicle for social interaction with family and friends. Community Outdoor segment members identify their primary motivation for engaging in outdoor activities is to spend time with family and friends there. Comprising 13.5% of all outdoor consumers, this group participates frequently enough and spends enough to fit into the “active” category of segments. They seek a mix of emotional rewards including happiness, calm, and balance. This segment is dominated by women who are looking at activities that bring their families and their communities together.
KEY INSIGHTS:
- Market Size & Identity: 13.5% of outdoor consumers fall into this segment; majority are women (57%) and parents, with an average age of 36 though 43% are over 45.
- Participation Patterns: Lowest frequency among the active segments (monthly on average, ~3.9 participation score); walking, running, biking, and hiking are most common activities, while hunting, paddling, climbing, and snow sports lag.
- Purchase Drivers: Buy primarily because old products are worn out, for planned excursions, or as gifts; mothers often lead decision-making.
Motivations: available in full report
Spending Behavior: available in full report
Decision Influences: available in full report
Product Preferences: available in full report
Shopping Channels: available in full report
Demographics: available in full report
Socioeconomic Traits: available in full report
MEMBERS GET ALL THE INSIGHTS. JOIN TODAY.
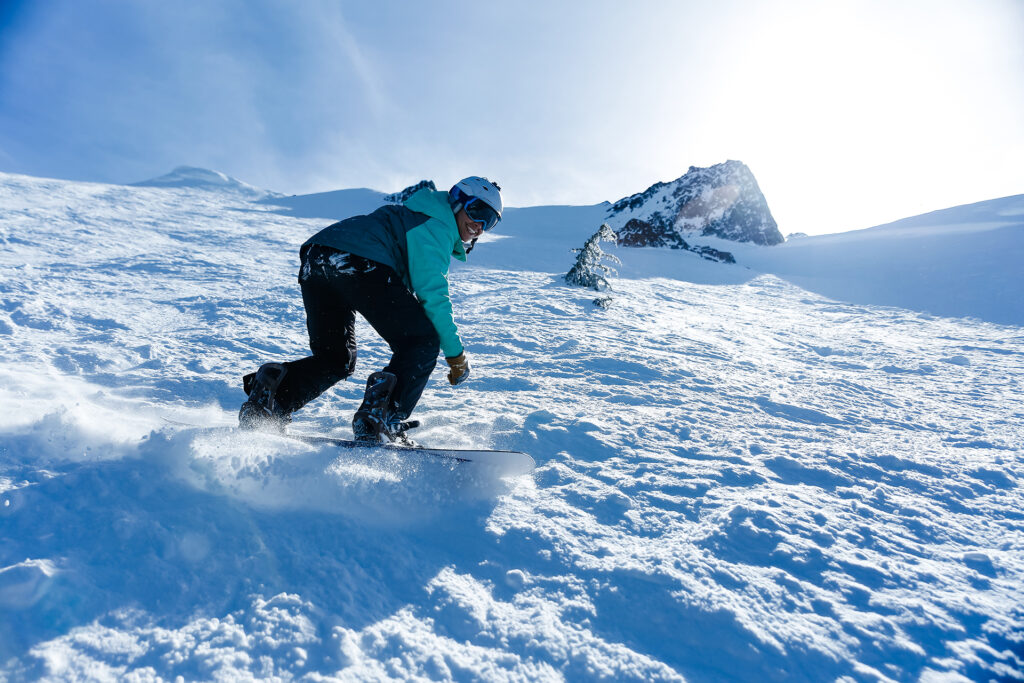
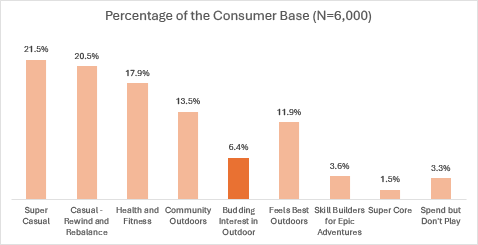
THE BUDDING INTEREST IN OUTDOORS SEGMENT
The Budding Interest in Outdoor segment represents a small but highly engaged portion of the outdoor recreation community, comprising 6.4% of outdoor consumers. These individuals are motivated by a growing enthusiasm for outdoor activities such as hiking, camping, and biking, and view the outdoors as a source of fun, excitement, and personal balance. As one of the “Active” segments, they participate in outdoor activity frequently and have notably high gear and apparel spending, reflecting a mid-level intensity in their outdoor pursuits. With a demographic profile skewing slightly older, predominantly white, and almost evenly split by gender, this segment is ripe with opportunity for brands and retailers, especially those offering new experiences, durable gear, and technical innovations.
KEY INSIGHTS:
- Market Size & Identity: Comprises 6% of outdoor consumers; second in the Active group with high frequency, mid-level intensity, and spending.
- Participation Patterns: Most active of the Active segments, often engaging in outdoor activities more than 50 times annually.
- Purchase Drivers: Buy gear primarily due to wear and tear, to start new activities, or to prepare for an upcoming adventure.
Motivations: available in full report
Spending Behavior: available in full report
Decision Influences: available in full report
Product Preferences: available in full report
Shopping Channels: available in full report
Demographics: available in full report
Socioeconomic Traits: available in full report
MEMBERS GET ALL THE INSIGHTS. JOIN TODAY.
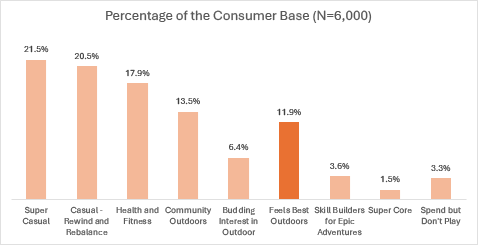
THE FEELS BEST OUTDOORS SEGMENT
The Feels Best Outdoors segment represents 12% of all outdoor consumers and stands as the fifth largest among nine defined segments. Characterized by a moderate level of intensity and spending, this group finds a strong emotional connection with the outdoors, where they report feeling happiest, calmest, and most excited. With an average age of 42 and nearly even gender split, this segment is predominantly white and middle-aged, with most members participating in a variety of outdoor activities more than 50 times a year. Their approach is not about competition or performance but about emotional well-being, variety, and consistency. They seek durable, functional gear that enhances their time outdoors and prefer shopping through both in-store and online channels, with Amazon and mass retail leading their purchasing destinations.
KEY INSIGHTS:
- Market Size & Identity: Represents 12% of outdoor consumers; moderately aggressive, high-frequency participants.
- Participation Patterns: Frequent participants in walking, running, biking, and hiking; open to new activities and challenges.
- Purchase Drivers: Buy when gear is worn out or when planning their next adventure.
Motivations: available in full report
Spending Behavior: available in full report
Decision Influences: available in full report
Product Preferences: available in full report
Shopping Channels: available in full report
Demographics: available in full report
Socioeconomic Traits: available in full report
MEMBERS GET ALL THE INSIGHTS. JOIN TODAY.
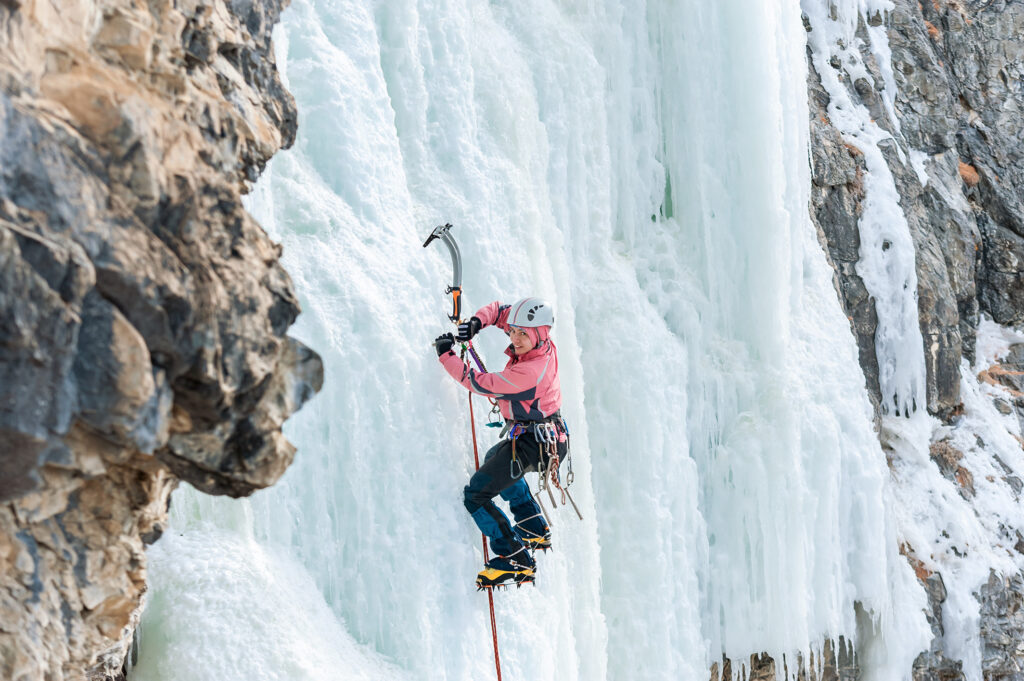
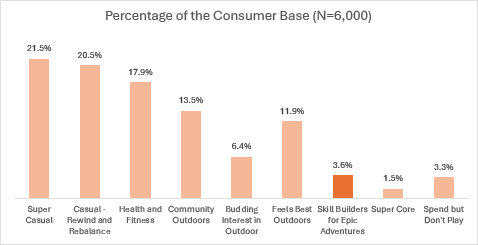
THE SKILL BUILDERS For EPIC ADVENTURES SEGMENT
The Skill Builders for Epic Adventures segment consists of highly engaged outdoor enthusiasts who are driven by a desire to improve their skills and abilities in pursuit of more epic and adventurous outdoor experiences. Representing just 4% of outdoor consumers, this segment is small but influential, characterized by high participation rates, significant spending, and an aggressive approach to outdoor activities. Members of this segment are focused on both the emotional rewards of being outside—particularly excitement—and the technical advancement of their performance. They are committed learners, inquisitive shoppers, and aspirational adventurers who actively seek products and experiences that help them level up.
KEY INSIGHTS:
- Market Size & Identity: The Skill Builders segment comprises 4% of outdoor consumers, the third smallest of nine segments but part of the “Core” group with high intensity and spending.
- Participation Patterns: They are frequent participants—more than 50 times a year—ranking second in overall activity frequency.
- Purchase Drivers: Buy when gear is worn out or to improve skills; drawn to innovative designs that improve performance.
Motivations: available in full report
Spending Behavior: available in full report
Decision Influences: available in full report
Product Preferences: available in full report
Shopping Channels: available in full report
Demographics: available in full report
Socioeconomic Traits: available in full report
MEMBERS GET ALL THE INSIGHTS. JOIN TODAY.

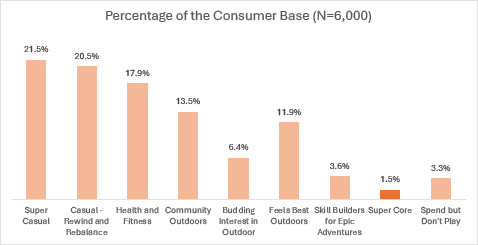
THE SUPER CORE SEGMENT
The Super Core segment represents the most intense and dedicated group of outdoor consumers, defined by their aggressive pursuit of outdoor experiences and unmatched frequency of participation. Comprising just 2% of the total outdoor market, this segment may be small in size, but it carries outsized influence due to its high levels of spending, engagement, and brand interaction. These consumers aren’t just outdoor enthusiasts—they live and breathe adventure, constantly pushing boundaries and seeking thrills to escape boredom. With a focus on excitement, performance, and advancement, the Super Core embodies what many in the industry have traditionally assumed all outdoor consumers aspire to be—yet data shows this extreme level of engagement is rare. Their behaviors, motivations, and preferences offer important insights for brands and retailers aiming to serve their most passionate, committed customers.
KEY INSIGHTS:
- Market Size & Identity: Comprises only 2% of outdoor consumers, just slightly smaller than the Skill Builders segment—together, the Core segments make up only 5% of the total.
- Participation Patterns: Super Core members engage in outdoor activities over 100 times per year, with top activities including walking, running, fishing, and hiking.
- Purchase Drivers: Wear and tear, new activity adoption, and desire to level-up skills motivate purchases.
Motivations: available in full report
Spending Behavior: available in full report
Decision Influences: available in full report
Product Preferences: available in full report
Shopping Channels: available in full report
Demographics: available in full report
Socioeconomic Traits: available in full report
MEMBERS GET ALL THE INSIGHTS. JOIN TODAY.

THE SPEND BUT DON’T PLAY SEGMENT
The Spend but Don’t Play segment represents a unique group within the outdoor consumer base: individuals who do not participate in outdoor activities themselves but still purchase outdoor products, often as gifts or for everyday use. Making up about 3% of all outdoor consumers, this group contributes modestly to the market, spending the least of any segment. While their direct outdoor engagement is nonexistent, their purchases—often apparel, footwear, or gear for others—still play an important role in driving sales during key retail periods like the holidays. Their buying habits highlight the indirect influence of outdoor recreation, as their motivations are rooted in supporting others and expressing care rather than personal participation.
KEY INSIGHTS:
- Market Size & Identity: Represents 3% of the outdoor consumer base; defined by non-participation in outdoor activities but still buying outdoor products.
- Participation Patterns: Gift-giving is the main driver of purchases; outdoor footwear and apparel are also used as everyday lifestyle wear.
- Purchase Drivers: Only 32% of members purchased any outdoor products during the reporting period.
Motivations: available in full report
Spending Behavior: available in full report
Decision Influences: available in full report
Product Preferences: available in full report
Shopping Channels: available in full report
Demographics: available in full report
Socioeconomic Traits: available in full report
MEMBERS GET ALL THE INSIGHTS. JOIN TODAY.